Copyright Notice: All code and ideas expressed in this article, are Copyright AI Factory Ltd.
You may use these, only with the direct written permission of AI Factory Ltd.
Developing programs requires skill to convert algorithms into code. However it also fundamentally depends on the coder's ability to both provide and make use of development tools to have effective product creation plans. This is a mix of using good off-the-shelf tools and good development strategies.
This article will be the first of a minor series, picking out one aspect of our development: The use of embedded diagnostics.
Creating program prototypes under windows:
We know a few programmers who have not adapted well to the post-console world of Windows programming, which generally makes IO something quite complex. Now you need to consider handles, messages and windows in order to get information displayed. This, of course, offers a greatly enhanced capability for displaying information, which can be directed to multiple windows in parallel. Thus program interfaces can easily become quite lavish. Diehard console programmers are also not left totally in the cold, as windows (C++) offers console apps, so that the user can write code "just as they used to", with a serial streamed output.
However the world runs on lavish interfaces, and any development started in a console app does not necessarily provide an easy migration path to going on to create a full blown conventional Windows application.
What we have done is to try and have our cake and eat it. Console programming offers significant advantages over just displaying text to bitmapped windows. For a start, it is easy and offers an easy option for textual post processing: An output trace can be later searched for key messages, copied formatted and used to create source tables. If you take development notes, you can copy and paste from a text output into your notepad. In there you can edit text and search on its contents. Doing this from a bitmapped window is not so convenient. Sure, bitmap screengrabs have the advantage of giving an exact representation of a screen output, which is good for recording display defects, so has an important role. However it is a dead end snapshot, which does not provide conversion to a searchable and editable ASCII textual log.
In consequence, we have embraced the console app as the root of product development, as follows:
Development Strategies
Our particular field is primarily in developing AI and such related work. Creating AI is really a prototyping activity, more than just an implementation of a specification, so this greatly benefits from being able to generate diagnostic and other output during the development cycle. The analysis being completed by the AI may require a detailed output to describe its analysis. Console output makes this convenient, as console IO in C++ is very simple and easy to generate.
Prototypes and Release Issues
Ok, so we use console apps, providing easy output driven by streams, and more helpfully, using the standard library, using printf(). For example you can easily display a line of text by just inserting:
printf("This is move %d of %3d moves\n", number, total);
For those unfamiliar with this, the initial quoted string is the text to be output, and "%d" takes the next parameter and displays it as an integer. "%3d" takes the next again ("total" in this case) and forces it to a 3 column width output. The final "\n" outputs a line-feed. This powerful printf command allows complex formatting, so that it is easy to create tables etc.
This is a boon when testing a prototype. When you need information, you can output extra diagnostics and help text, in order to determine what your code is doing. Of course you have a problem if you then do not want this text in the release version, in which case C++ comes to your aid, with conditional compilation. e.g.
for ( number = 1 ; number<total ; ++number ) {
Here putting the conditional compilation around the printf means that it only gets compiled if PROTOTYPE is defined, a trick which can be repeated throughout the source.
However this is not tidy or particularly convenient, so we have made use of C++ macros to let us embed printfs without attached conditional compilation. The code above would be replaced by:
for ( number = 1 ; number<total ; ++number ) {
Note that this is not exactly the same. We provide a series of macros printf1, printf2 etc.. You need to count the number of parameters, rather than have a general single printf for all. The printf3 line above can be removed from compilation by declaring the macro:
#define printf3(x,y,z)
This causes the pre-processor to remove the printf, before it is compiled. So at a stroke all printf3 statements can be disabled in the sources by the use of the conditional expression in a global header file:
#ifdef PROTOTYPE
Now you can have huge volumes of embedded diagnostic output that disappears in the release build. This may look a bit low tech. We are using C++, so why not use classes to create this kind of facility? The answer is that it is very portable, and will also work on systems that can only accept C, where using classes is not an option. Note also that C++ is not fully supported on all systems. Sometimes this is intended and sometimes just a bug that may or may not eventually get fixed. Relying on all the features of C++ to be supported is risky. Better to limit to the dependable C core of C++, if you really want to stay portable.
Ramping up Diagnostics
The simple technique above is very helpful for allowing massive volumes of diagnostic text to remain permanently in the sources, even for the release. These can then be re-activated for testing. These diagnostic statements can also partly do the job of comments, as they can be read in-line in the source. However as this is rather all-or-nothing, we have expanded it to provide two distinct levels, as follows:
printf3(…
The second version of the printf actually expands to a condition expression, of the form:
#define _printf3(x,y,z) if ( _tr_debug ) {printf(x,y,z)}
This makes the printf conditional, so that it only runs if _tr_debug is true. It is linked into out testbed console so that tracing can be turned on and off at will. You may not always want this, so that printfx and _printfx macros may be removed by different conditionals. In our case it is controlled by the define TRACE_LEVEL, which has all diagnostic trace embedded at level 4 and only basic printfx type for level 1. Values 2 and 3 can be used for special cases of printfx, which you can still selectively disable. Values above 4 can be used for extended extra conditional tracing, e.g. using
#if TRACE_LEVEL > 4
This clearly starts to become untidy again in in-line code, but is an extra to the main two reduced forms of just using printfx and _printfx. In practice our system provides much more, which will be covered in a later article.
Ramping up to Colour
Reading a text stream is OK if short, but maybe you are looking for some special type of diagnostic, among hundreds of lines of output. This is where console apps under Windows come into their own. The API supports colour through SetConsoleTextAttribute(), however it is of limited help if it requires the user to replace a single printf by many lines of code, so we have our own printf, which supports in-line colour control, as follows:
| &&<forecolour> | where | <forecolour> is one of the colours below | |||
| e.g. | &&b | foreground blue | |||
| &&_<backcolour> | &&G | foreground bright green | |||
| e.g. | &&_r | background red | |||
| &&>x,y | e.g. | &&>2,3 Move cursor to column X and row Y .e.g. &&>2,3 | |||
| &&=x,y | e.g. | &&=80,25 Set window size to 80x25 | |||
| &&& | get printed as && | ||||
| <all others are printed as literals> | |||||
| The colours available are: | |||
| k | black | The capitalised versions of these give "Intensity" | |
| b | blue | ||
| g | green | ||
| c | cyan | ||
| r | red | ||
| m | magenta | ||
| y | yellow | ||
| w | white | ||
| + | switch to bright green if following number is >0 and bright red if following string is -ve number | ||
| - | switch to cyan if following string is -ve number | ||
These embedded strings allow colour to be easily introduced. e.g.
printf3("This is move &&W%d&&w of &&Y%3d&&w moves\n", number, total);
This switches to "bright" white for the first number, switching back to normal white, then switching to bright yellow for the next etc. It also allows backdrop colours to be modified the same way.
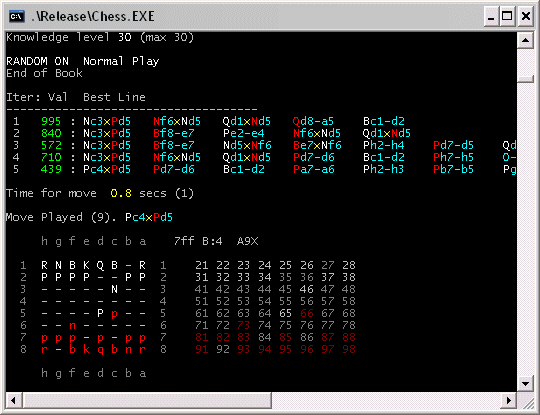
Now the console output trace is easier to read:

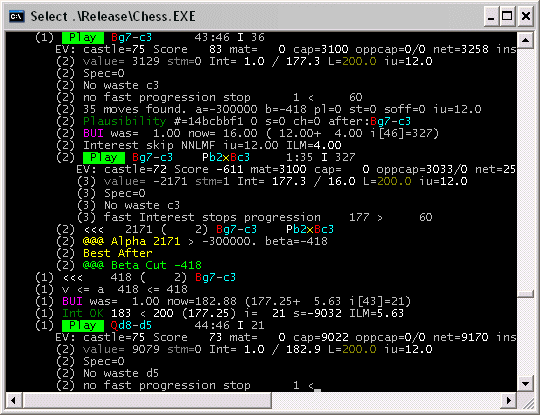
Colour tracing analysis also makes it easier to see particular details:

Here we can see the tree search trace for our chess. The leading numbers are the search depth, and the output is automatically indented to show this.
Conclusion
It may not look like rocket science, but this provides an easy-to-use facility that makes prototype development much easier and quicker. It encourages insertion of debugging, because it is very easy to do so and does not need to be removed before release. This encourages more extensive testing and allows a release version of a program to continue to be developed, as the diagnostic tracing is still there.
Consider some more serious bugs. You may know that some new modification has produced some undesired output. This may be hard to understand. By turning on tracing, you can dump the trace to a file, and then repeat with the new modification, which may create two 20 megabyte trace outputs. All you need do is run this through WinDiff (or the much better DiffZilla), and it will point to the place where something has changed. Perhaps one figure is different, which would be impossible to spot by hand.
A console app with colour control, combined with conditional compilation, provides a powerful tool for program development. A future article will take this further, exploring further the toolset used at AI Factory.
Jeff Rollason and Dan Orme - December 2006
